Map 20 Years of Legacy in 2 Hours
Most teams inherit software, not source code.
You get a folder tree, a CI job that only one person understands, and a set of rules passed down by memory. You know the system ships value. You do not know where the edges are or what breaks if you touch them. LensHub's visualization engine was built for that moment. It turns sprawling, multi-year codebases into a navigable map you can trust, fast enough to matter to a sprint.
This is a guided tour of how it works, what it reveals, and how to use it to make safer decisions tomorrow morning.
What "the map" actually is
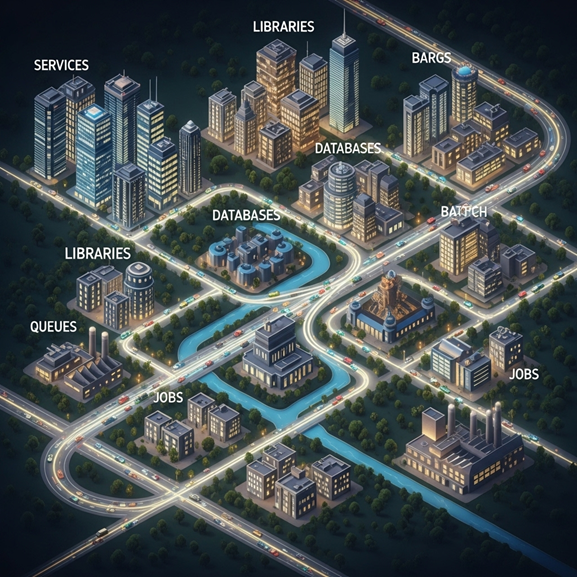
Think of the codebase as a city. Files become buildings, services become districts, databases and message buses become transit, and scheduled jobs become night traffic. LensHub builds the city map with layers you can toggle.
- Structure layer shows repositories, services, libraries, tables, topics, and jobs with their direct dependencies.
- Behavior layer overlays runtime paths from logs and traces, so call graphs reflect how the system moves under real load.
- Time layer adds commit history, authorship, and churn, so you see not only what exists but what changes often.
- Risk layer highlights hotspots where complexity, coupling, low test coverage, or ownership gaps combine.
- Shadow layer surfaces spreadsheets, scripts, and ad hoc APIs that talk to your system without a paper trail.
The result is not a pretty picture. It is a living model that answers plain questions.
How we build it without stopping your day
Step 1. Intake
Point LensHub at your repos and observability sources. We ingest code, build files, commit history, logs, traces, and schema definitions. Nothing leaves your network by default.
Step 2. Parse
We run a fast static analysis across supported languages, parse ASTs, identify modules and public interfaces, extract SQL and message schemas, and locate configuration, secrets references, file system assumptions, and scheduled jobs.
Step 3. Correlate
We align static structure with runtime behavior. The engine matches routes, function signatures, queue topics, and SQL tables to the traces and logs that reference them. This is where the map becomes honest. If a call exists in code but never runs, you will see it as cold. If a path exists only at 2 a.m. on the last day of the month, it will glow on the timeline.
Step 4. Rank
Every node gets simple scores. How central is it. How often does it change. Who owns it. How well is it tested. Does it sit on a critical revenue path. You can sort the map by value or by risk in seconds.
Step 5. Explain
A small language model writes short, linked explanations for top nodes. Each summary links back to code, recent commits, and runtime evidence. The explanations are there to get a human oriented, not to replace code reading.
All of this happens in a controlled lane. Your CI keeps running. Your developers keep shipping.
What you can ask the map
What breaks if we change X
Click any module, endpoint, topic, or table. The map shows upstream callers and downstream consumers by weight of usage. You get a true blast radius, not a guess.
Where should we start modernizing
Sort by high value and high risk. You will see the places with heavy traffic, weak tests, frequent changes, and unclear ownership. Those are the slices that deserve early attention.
What is safe to delete
Toggle the time layer to show code that has not executed in months and receives no calls in traces. LensHub proposes a deletion plan with linked evidence and a rollback note.
Why is this fragile
Open a hotspot and you will see the reasons in one view. Cross-service coupling, complex functions with multiple responsibilities, reflective calls into internals, or forks of libraries that have drifted from upstream.
Who knows this best
Ownership is not just a name in a file. LensHub shows the humans linked to recent changes and incidents, so you can find reviewers and pair partners without DM archaeology.
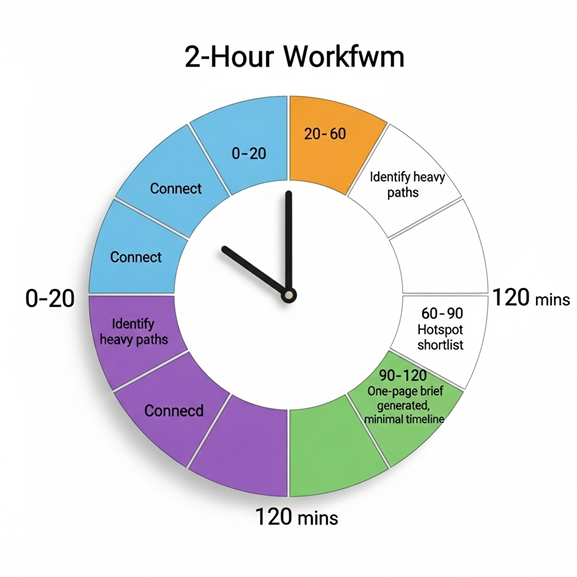
A two-hour walkthrough you can try on day one
Minutes 0 to 20
Connect repos, log and trace sources, and schema registries. Start the first scan. Grab coffee.
Minutes 20 to 60
Open the Structure and Behavior layers. Identify the three heaviest paths by traffic and revenue. Pin them to your board. You now have a shared vocabulary for a conversation with product and finance.
Minutes 60 to 90
Switch on the Time and Risk layers. Look for hotspots where high traffic meets high churn and low test coverage. This gives you your first short list of modernization candidates.
Minutes 90 to 120
Pick one candidate. Click "brief." LensHub generates a one-pager: what it does, who touches it, what breaks if it changes, test gaps to close, a parity plan, and the smallest safe slice to move first. You finish the session with a decision you can defend.
No workshops. No standing meetings. Just a shared map and a next step.
Why engineers trust it
Evidence first
Every node and line has links back to code, commits, and traces. The model does not invent facts. If the map says a path is unused, you can click through to the last time it ran.
Plain language with receipts
Explanations are short and attached to proof. They reduce time to understanding but never hide the source.
No heavy process
The visualization is useful on its own. You can paste a screenshot into a pull request, drop a link in a design doc, or keep it open during incident review.
No lock in
The map does not force a framework or repo layout. It reads what you have and reflects it honestly.
Why leaders use it
Clarity over opinions
The question "where should we start" stops being a debate. The map shows where risk and value concentrate.
Faster onboarding
New engineers can see the story of the system in a morning. They learn how services connect and which paths matter most before they open an editor.
Better planning
Roadmaps become easier to negotiate when you can point to hotspots and revenue paths in one view. You can stage modernization alongside features instead of pausing for a rewrite.
Board-ready visuals
A single image showing risk retired over time is easier to defend than a deck full of jargon.
What the map will not do
It will not auto-fix your architecture. It will not push changes to production. It will not claim certainty where it has none. Unknowns are marked as unknowns. The goal is to make good decisions obvious and risky work visible, not to pretend the system is simple.
Privacy and safety
Source code stays in your network by default. Analysis happens where your code lives. Only derived metadata powers the visualization. Secrets are detected and excluded from indexing. Logs and traces can be scoped by namespace or service, so sensitive domains remain private while the big picture stays useful.
A short story that shows the point
A logistics firm handed us a monorepo that had grown for thirteen years. The team's main pain was an unpredictable weekly job that reconciled orders, inventory, and partner feeds. The map showed why within the first hour. The job touched six services, wrote to a local file share, and depended on a report that lived in Access. Runtime traces confirmed the job ran three times as long on the last Friday of every month when a partner posted late data.
With that truth in hand, the team replaced the file share with object storage, moved the Access logic into a small service, and added a guard at the API edge to normalize a partner's drifting date format. They did not rewrite the job. They removed three fragile points. Incidents dropped. The job time became predictable. The map's Risk layer cooled from red to calm blue.
How to use the map tomorrow
Open the map in standup. Pin the top three revenue paths. Pin the top three hotspots. Agree on one hotspot to address in the next sprint. Use the generated brief to define the scope and the parity checks. Share the before and after view at the end of the sprint. Repeat.
Small moves feel safe when you can see the whole city.
Map Your Legacy System in 2 Hours
If you want to see your system this way, ask for a two hour Map Sprint. We will connect to your repos and observability, build the layers, and leave you with a one-page brief for the first safe slice to tackle. No guesswork. No frozen roadmap.